자연어처리(빈도분석)
빈도분석
데이터 로딩
    # cp949는 행과 열로 구성되어있는 데이터를 읽을 때 사용
    def read_data(filename, encoding='cp949'): # 읽기 함수 정의
        with open(filename, 'r', encoding=encoding) as f:
            # 열 사이는 \t로 나뉘어져있고 라인 별로 가져와서 리스트 형태로 저장한다.
            data = [line.split('\t') for line in f.read().splitlines()]
            data = data[1:] # txt 파일의 헤더(id document label)는 제외하기
        return data
    def write_data(data, filename, encoding='cp949'): # 쓰기 함수도 정의
        with open(filename, 'w', encoding=encoding) as f:
        f.write(data)
    data = read_data('ratings_small.txt' , encoding='cp949') # 전체파일은 ratings.txt
전체 데이터 형태소 분석
    morphed_data =
    ''
    for data_each in data:
        morphed_data_each = rhinoMorph.onlyMorph_list(rn, data_each[1], pos=['NNG', 'NNP', 'VV', 'VA', 'XR', 'IC', 'MM', 'MAG', 'MAJ'], eomi= True)
        joined_data_each = ' '.join(morphed_data_each) # 문자열을 공백을 두고 하나로 연결
    if joined_data_each: # 내용이 있는 경우만 저장하게 함
        morphed_data += data_each[0]+"\t"+joined_data_each+"\t"+data_each[2]+"\n"
    # 형태소 분석된 파일 저장
    write_data(morphed_data, 'ratings_morphed.txt', encoding='cp949')
Counter
리스트의 구성요소를 종류별로 빈도를 계산한다.
    from collections import Counter
    mergedText = ' '.join(morphed_data) # 좋은 방법. 공백을 추가하며 일단 모든 리스트 요소들을 결합한다, 텍스트를 읽어올 경우 없어도 된다.
    print('mergedText:', mergedText)
    mergedTextList = mergedText.split(' ') # 결합된 요소들을 공백 단위로 분리하여 하나의 리스트로 만든다
    print('mergedTextList:', mergedTextList)
    wordInfo = Counter(mergedTextList) # 하나의 리스트로 묶인 분리된 요소들을 카운트한다 (내림차순)
    print('wordInfo:', wordInfo)
시각화 전 정렬
    sample = {'여름':1, '과일':2, '딸기':3}
    print(sorted(sample, reverse=True)) # 역순으로 정렬 -> 여름 딸기 과일
    print(sorted(sample, key=sample.get, reverse=True)) # sample.get의 출력된 값을 기준으로 sample을 정렬 ex)-> 딸기 과일 여름
    print(sorted(sample.values(), reverse=True)) # 값 부분만 출력하여 정렬 -> 3 2 1
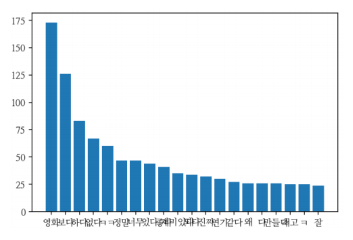
시각화
    # 앞에서 20개까지만 출력
    sorted_keys = sorted(wordInfo, key=wordInfo.get, reverse=True)
    sorted_values = sorted(wordInfo.values(), reverse=True)
    import matplotlib.pyplot as plt
    plt.bar(range(20), sorted_values[:20]) #y축
    plt.xticks(range(20), sorted_keys[:20]) #x축
    plt.show()

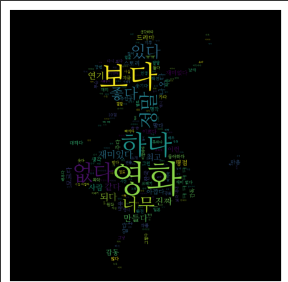
Word Cloud
    !pip install wordcloud # 워드클라우드 패키지 설치
    from wordcloud import WordCloud
    # 기본 배경은 블랙이고 background_color 로 색을 지정할 수 있다.
    cloud = WordCloud(font_path=fontpath, width=800, height=600).generate(" ".join(data_text))
    plt.imshow(cloud, interpolation='bilinear') # 글자를 더 부드럽게 나오게 한다
    plt.axis('off') # 축의 위치 정보 off
    plt.show()

- 마스크 지정하기
wordcloud에 이미지를 입혀서 구성할 수 있다.
    alice_mask=np.array(Image.open(path.join(d,"alice.png")))
    cloud = WordCloud(font_path=fontpath, width=800, height=600).generate(" ".join(data_text))

Leave a comment